
If your website traffic is down twenty to forty percent this year while your phone rings about as often as it always did, your marketing probably isn’t broken. Your measurement is. Somewhere between 60 and 68 percent of Google searches now end without a click to any website, and when an AI Overview appears at the top of a result page, click-through to the top organic listing drops sharply. Fewer people are visiting your site to get information they can now get without leaving Google.
The part that gets lost in the panic: the people who do still click are further along and better qualified than they used to be, because the AI answer already filtered out everyone who was just curious. Visitors arriving after an AI system mentioned a business convert at meaningfully higher rates than traditional organic traffic did.
So sessions went down and the business didn’t. That’s an uncomfortable place to be if sessions are the only number on your report. Here’s how to tell the difference between a traffic problem and a measurement problem, and what to put on the report instead.
First, Rule Out an Actual Problem
Before you accept “it’s just AI,” check that something didn’t genuinely break. Traffic drops have boring causes more often than dramatic ones.
Compare impressions to clicks in Search Console. This is the single most diagnostic view you have. If impressions are stable or rising while clicks fall, you are still ranking and still being shown - people simply aren’t clicking through. That is the zero-click pattern. If impressions fell too, you have a ranking or indexing problem and the AI explanation is a distraction.
Check for the mundane causes. A site migration that lost redirects. A noindex left on after a redesign. A robots.txt change. An expired SSL certificate. A page speed collapse after someone added a tracking script. A Google Business Profile suspension pulling you out of the map pack, which we cover in Google’s video verification changes. Any of these will drop traffic and none of them have anything to do with AI.
Check whether analytics is still recording. Consent banner changes, a botched tag update, or an ad blocker shift can make traffic look like it fell off a cliff when it didn’t. If the drop is a vertical line on a specific date rather than a slope, suspect the tracking before the market.
Segment by page type. Informational blog content is where AI has taken the biggest bite. Service pages, location pages, and anything with commercial intent usually hold up far better. If your blog traffic halved and your service pages are flat, that’s the AI pattern behaving exactly as expected.
Only once all that checks out should you conclude the drop is structural rather than a fault.
Why the Traffic Went and the Leads Stayed
The mechanism is straightforward once you see it.
Someone searching “how much does a bathroom renovation cost” used to click three or four articles. Now they read the AI Overview, get a range, and never visit anyone’s site. Those are visits you lost, and they were never going to phone you this month anyway.
Someone searching “bathroom renovation Vernon BC” still needs a real business. They still see the map pack. They still click through to compare. Those are visits you kept, and they’re the ones that turn into work.
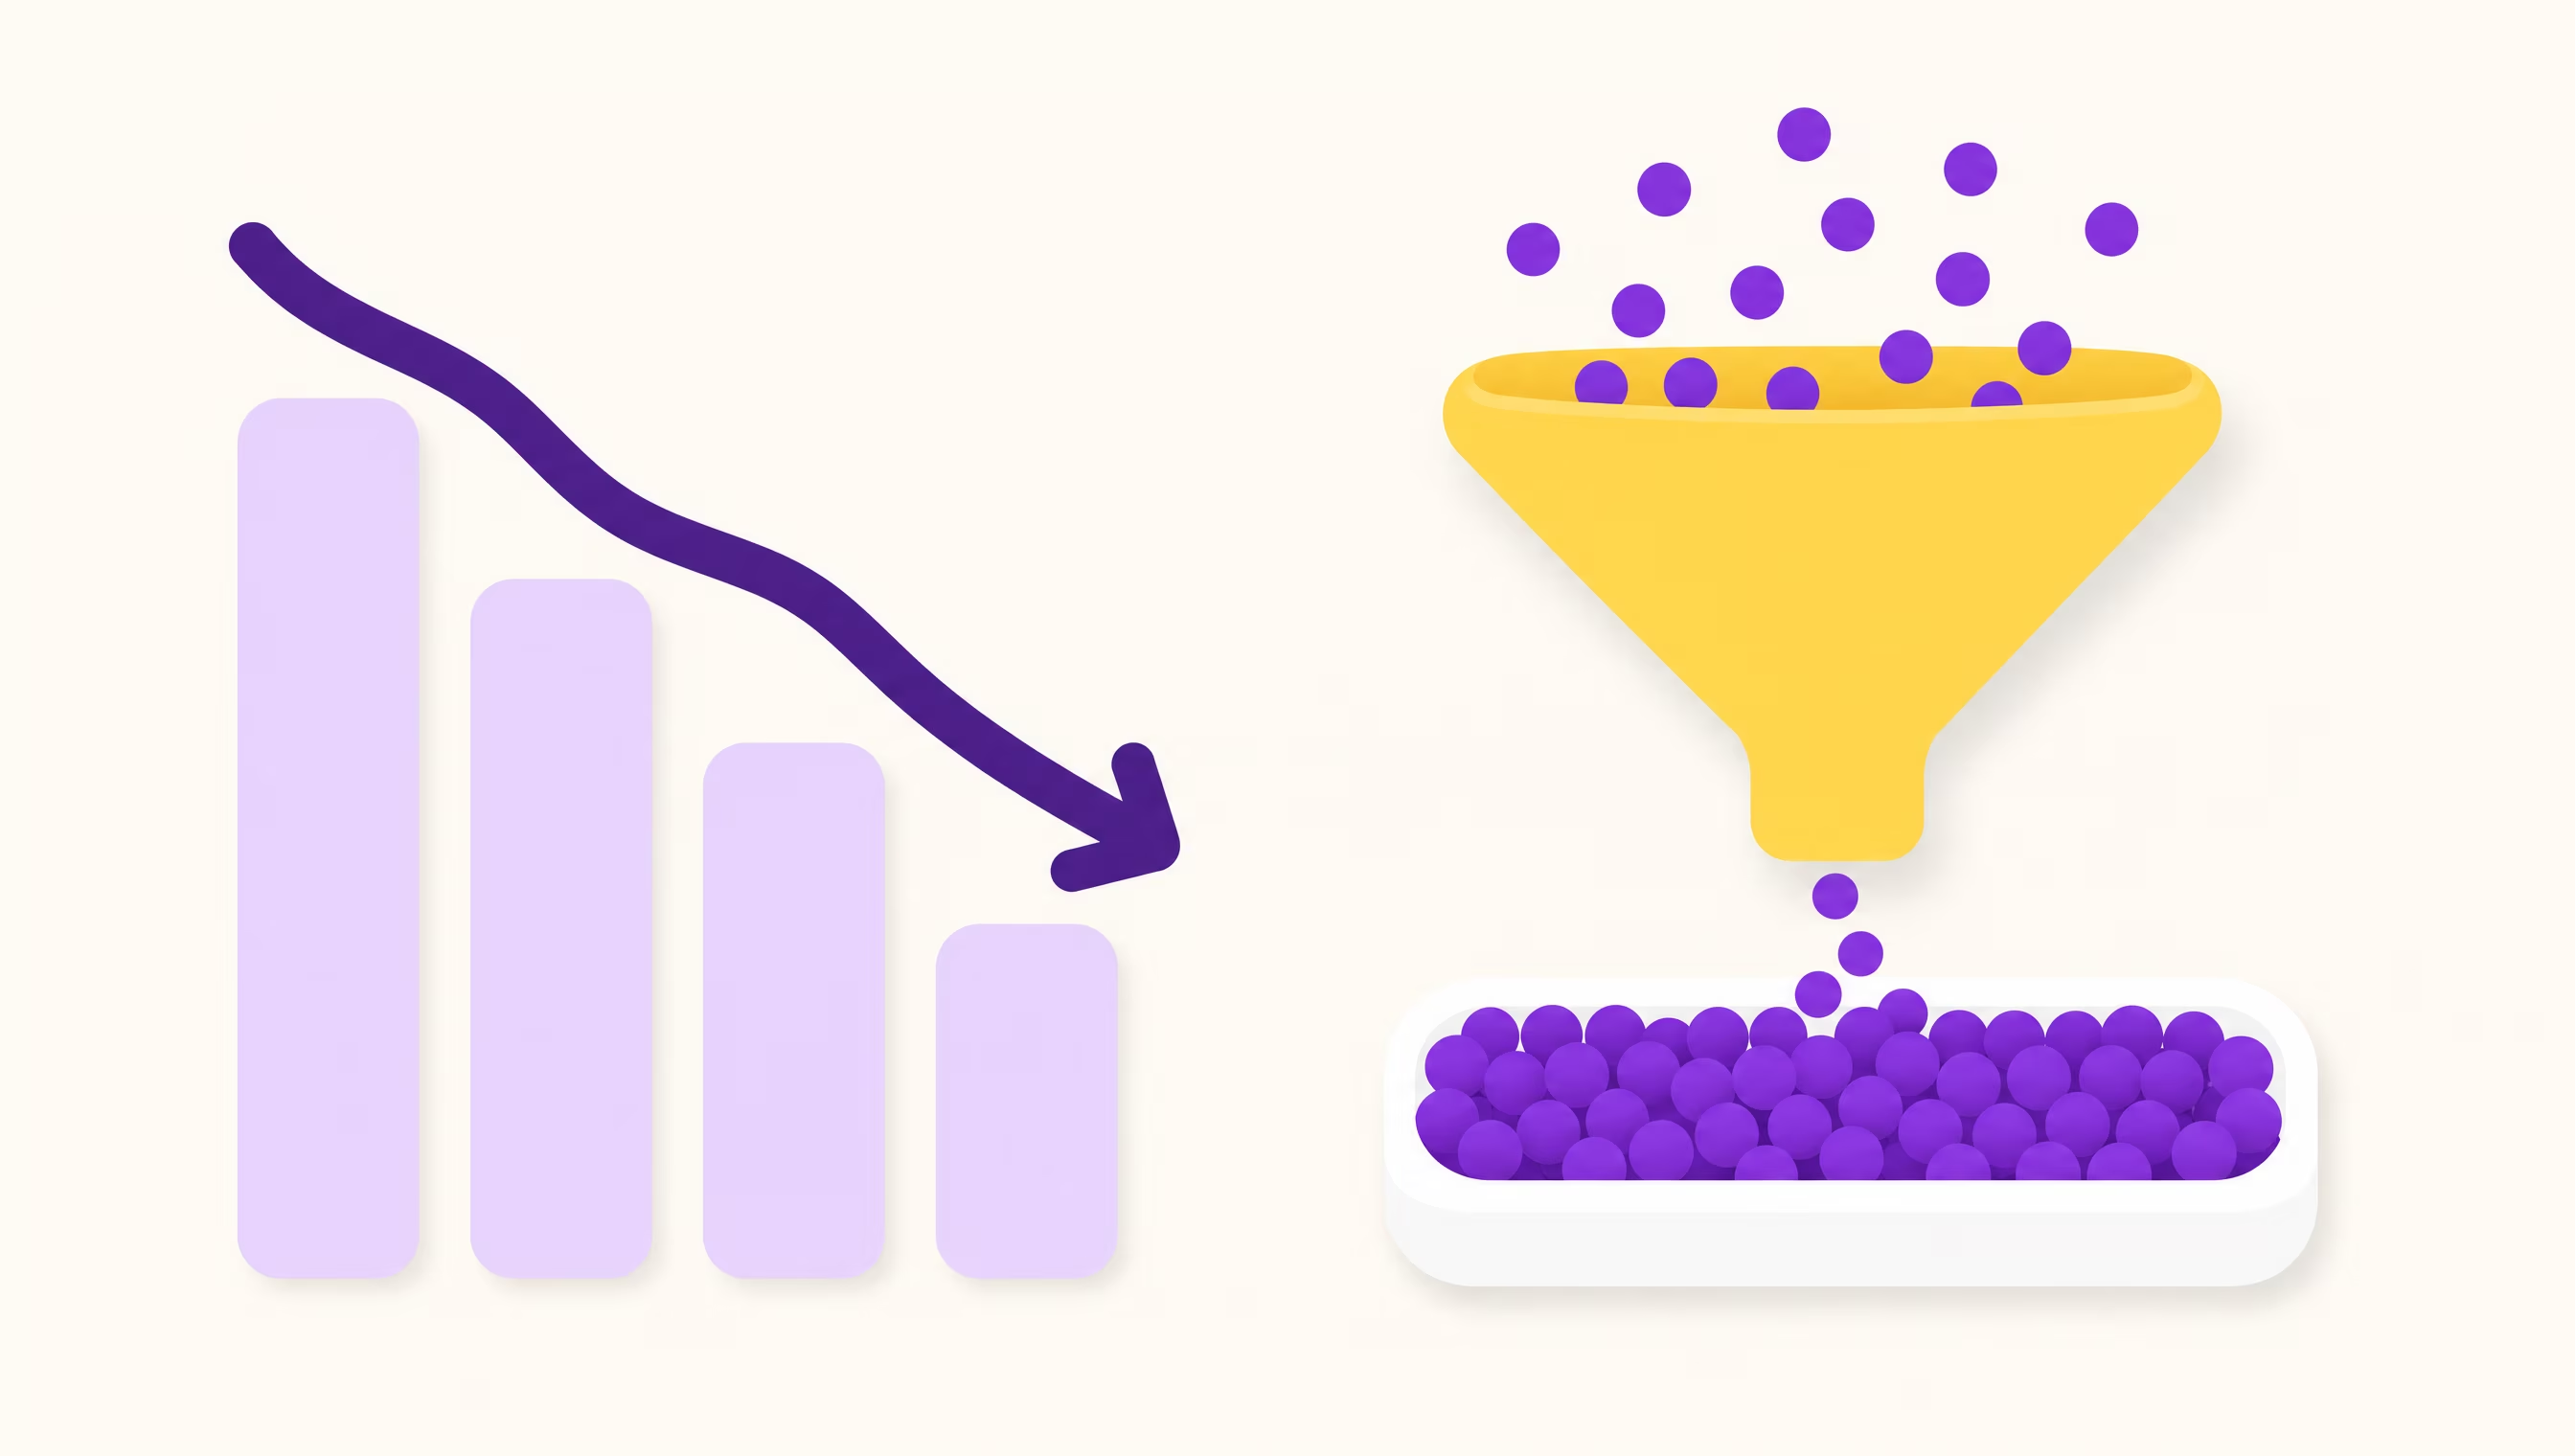
What AI removed from your analytics was mostly the top of the funnel - the browsers, the researchers, the students, the people three months out. What it left is denser. Your conversion rate probably went up this year, which looks like a win on one chart and gets buried under the traffic loss on another.
There’s a second effect that never shows up anywhere. When an AI answer names your business without linking to you, the searcher still saw your name. Repeat that across a dozen searches and you’ve built recognition that surfaces later as someone typing your business name directly into Google. That arrives in your reports as direct or branded traffic with no visible source, which is exactly why the AI channel looks smaller than it is.
What to Measure Instead
If sessions no longer describe your business, replace them. These are the numbers that still mean something.
| Metric | Why it survives | Where to get it |
|---|---|---|
| Calls, by source | The outcome, not a proxy for it | Call tracking numbers, or ask every caller |
| Form fills, with a source field | Same, and it self-reports attribution | A “how did you hear about us” field on every form |
| Branded search volume | Rises when AI names you, even with no click | Search Console, filtered to your business name |
| Direct traffic trend | Where AI-driven recognition lands | Analytics, watched as a trend not a number |
| Google Business Profile actions | Calls, direction requests, website taps from Maps | Business Profile insights |
| Generative AI impressions | Whether you appear in AI answers at all | Search Console AI reports |
| Conversion rate | Should be climbing as traffic gets denser | Analytics, or leads divided by sessions |
| Revenue per lead source | The only number that ends every argument | Your books |
The two at the top do most of the work. A “how did you hear about us” field on every form is the cheapest attribution system in existence and it consistently beats the analytics platform for accuracy, because people tell you things no tag can see. “I saw you in a ChatGPT answer” and “my neighbour mentioned you” are both real sources that no dashboard will ever record.
Call tracking matters more every year as clicks disappear. If your leads come by phone and you can’t say which channel produced which call, you are guessing about the majority of your marketing.
The Report That Actually Helps
Most small business marketing reports are a list of numbers with no argument in them. If yours has traffic at the top, rebuild it around this shape.
Start with outcomes. Leads this month, by source. Revenue from those leads if you can trace it. That is the headline, and everything else is explanation.
Then efficiency. Cost per lead by channel, and whether it is moving in the right direction. Conversion rate, which should be improving as the traffic gets more qualified.
Then visibility, framed as leading indicators. Search Console impressions, generative AI impressions, map pack presence, branded search volume. These predict next quarter’s leads. They are not this quarter’s results.
Sessions go last, if at all, and always alongside conversion rate so the two are read together. A twenty percent traffic drop with a forty percent conversion lift is a good quarter. Presented separately, it’s a crisis and a footnote.
If you work with an agency and their report leads with traffic and rankings without connecting either to leads, that’s worth a conversation. We wrote about what to look for in vetting web agencies.
What to Actually Change
Measuring it correctly doesn’t fix anything by itself. Three shifts follow from the diagnosis.
Stop writing content that AI answers better than you can. A generic “what is X” post is now competing with an instant answer at the top of the page. What still earns a click is content carrying something an AI can’t synthesise from the open web: your actual pricing, your real process, local specifics, first-hand results, opinions with a name attached. Depth and specificity over coverage.
Optimise for being cited, not just ranked. If a third of your visibility is now appearances rather than visits, you want those appearances. Lead with direct answers, structure content so passages extract cleanly, keep the technical foundation clean. Our Generative Engine Optimization guide for Canada covers the mechanics.
Put more weight on the channels AI doesn’t intercept. The map pack still sits above the AI Overview for local intent. Reviews still decide who AI recommends. Email still reaches people directly. Referrals still exist. Local and commercial intent is the part of search that has held up best, and for most Canadian small businesses it was always the part that paid.
TheBomb® has been building websites and running search for businesses across BC and beyond since 2014. We’ve watched this shift arrive in client accounts through 2025 and 2026, and the pattern has been consistent: traffic down, leads flat or up, and a lot of unnecessary worry caused by looking at the wrong chart.
Frequently Asked Questions
Why is my website traffic dropping in 2026?
The most common cause is zero-click search. Between 60 and 68 percent of Google searches now end without a click, and AI Overviews answer informational questions directly on the results page. Check Search Console first: if impressions are stable while clicks fall, you are still ranking and the drop is behavioural. If impressions fell too, you have a genuine ranking or technical problem such as a lost redirect, a noindex tag, or a Google Business Profile suspension.
Is losing traffic to AI Overviews actually bad?
Not necessarily. The visits AI absorbs are mostly top-of-funnel researchers who were unlikely to become customers soon, while commercial and local intent searches still route people to real businesses. Visitors who arrive after an AI system mentions a business tend to convert at higher rates because the answer pre-qualified them. Watch conversion rate alongside traffic, because a traffic drop with a conversion lift is often a healthier quarter than it looks.
How do I measure SEO if I can’t measure clicks?
Shift to outcome and leading-indicator metrics: calls by source, form fills with a “how did you hear about us” field, branded search volume, direct traffic trend, Google Business Profile actions, and generative AI impressions from Search Console. Outcomes tell you what the marketing produced, and visibility metrics predict next quarter. Sessions belong at the bottom of the report, read alongside conversion rate rather than on their own.
What is zero-click search?
Zero-click search is any search that ends without the user clicking through to a website, because the answer appeared directly on the results page in an AI Overview, featured snippet, knowledge panel, or map pack. It has grown steadily for years and accelerated sharply with AI Overviews. It affects informational queries far more than commercial or local ones, which is why service businesses generally see less damage than publishers.
Should I stop blogging if AI answers the questions?
No, but change what you blog about. Generic explainer posts that an AI can answer instantly are no longer worth writing. Content that still earns clicks and citations carries something the open web cannot synthesise: real pricing, your actual process, local specifics, first-hand results, and opinions attached to a named person. Fewer, deeper, more specific pieces outperform a high volume of thin coverage.
Want a Report That Tells You Something?
If your marketing report is a wall of numbers that never quite answers “is this working,” we can fix that. Get in touch and we’ll help you connect visibility to leads to revenue, so the next traffic dip is a data point instead of a fire drill. See how we approach it in our SEO services.
Key Takeaways
- Check Search Console first. Impressions steady with clicks falling is the zero-click pattern. Impressions falling too is a real problem.
- Rule out boring causes before blaming AI: lost redirects, a stray noindex, broken tracking, a suspended Google Business Profile.
- AI removed top-of-funnel visits, not buyers. Informational blog traffic takes the hit; service and location pages generally hold.
- Your conversion rate probably went up this year, which makes the traffic drop look far worse than the business result.
- Replace sessions with outcomes: calls by source, form fills with a source field, branded search, Business Profile actions.
- A “how did you hear about us” field is the cheapest and most accurate attribution tool you can deploy.
- Rebuild the report with outcomes first, efficiency second, visibility as leading indicators, and sessions last beside conversion rate.